Create your Business Intelligence Project for less than 7€ per Month – BI Low Cost Series (1/3)

In today’s post, I present a series of posts that will deal with 3 different Business Intelligence projects: low, medium and high cost. Depending on the volume of data and resources of our clients, we will know when to decide one type of project or another.
In this first part of this Series, Low cost BI Projects, we are going to start with the most economical, for those clients of small or medium companies who want to have a Functional Business Intelligence environment.
All the architectures that we show in the low cost BI Projects series will have: a data source, an analysis project and a viewer.
Budget
- Excel
- Power Bi Desktop
The following solution would cost us less than 7 euros per month.
Data Source
In this demo we are going to use an Excel data source, but an Access database could also be used.

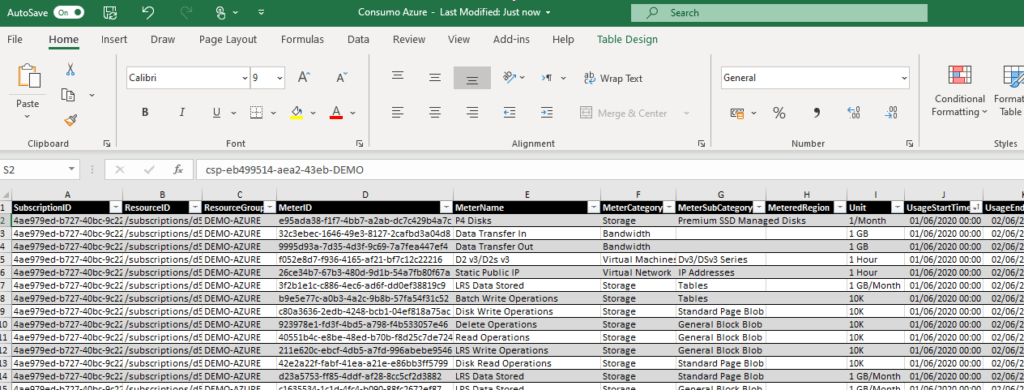
We will use the following Excel on the consumption of our Azure resources as a data source. In this xls file we can insert and delete records just like in a database. It may seem unprofessional and it is, but from my experience I have seen this use in a Big Companies. At the end, it is a simple and cheap solution that everyone knows how to use.
If you want to start a Business Intelligence Project visit our Data Analytics page and we will inform you.
Data Analytics
To carry out the analysis project we are going to use Power Bi Desktop. Power BI Desktop is a free application that can be installed on your local computer and allows you to connect to, transform, and visualize data. With Power BI Desktop we can connect to several different data sources and combine them into a data model.
We can download Power Bi Desktop here.
Once we have it installed on our local computer, we start and click on Get Data.Once selected, we will have the option to choose Excel as the data source.

We look for our Excel files and the following window will appear where we have to select the tab where the table is and then we will click on Load.

Then willstart loading the data into Power BI Desktop.
At the end of the data loading, we will be able to proceed with the transformation and modeling the data.
Data Visualization
For the preparation of the reports we will also use the leading tool in data visualization, Power Bi Desktop.
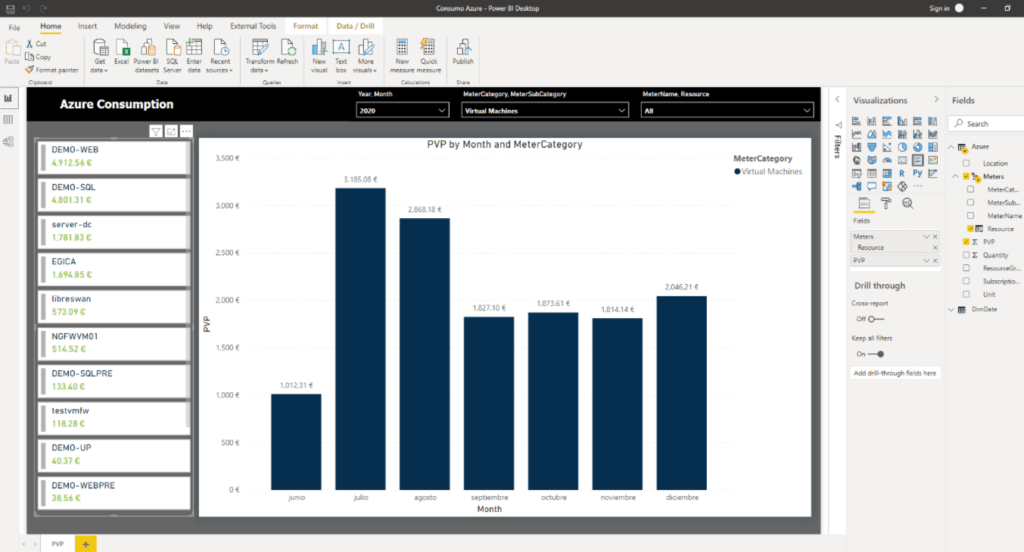
In the previous step we carried out the data load, and now we will proceed to use them. In this post, we are not going to go into detail about the operation of the Power Bi but, simply indicate that by selecting one of the visualizations that we have on the right side and dragging fields we can make incredible panels in a very simple and dynamic way like the one you see. I show in the following picture.

And here ends the first post of the Series on Business Intelligence Projects, I hope it will be of help to you when creating your Low Cost Project.
If you want us to advise you with the Creation of your Business Intelligence Project, contact us at info@aleson-itc.com or call +34 962681242.
Business Intelligence Expert Consultant. Specialising in creation of Data Warehouse, Analysis Services, Power BI, SSIS, SSRS and Databricks.

