Know the Waiting Stadistics or Waits for SQL Server

Welcome to a new post in the best SQL Server Blog. In today’s post we are going to talk about one of the most valued tools when creating wait statistics in SQL Server: The Waits.
But first, I will explain what Waits are and what their main functions are.
What are the Waits?
SQL Server Wait Statistics is an important tool used to analyze performance related issues or to optimize SQL Server performance. The timeouts are captured and recorded by SQL Server and all that captured information is called Wait Statistics and provides assistance in troubleshooting SQL Server performance related issues.
To know what types of waits we have in the Instance, we will use the following Script:
Ref: https://www.sqlskills.com/blogs/paul/wait-statistics-or-please-tell-me-where-it-hurts/
IMPORTANT
Wait statistics are one of the most important indicators to identify performance problems in SQL Server. When we want to solve any performance problem, we must first diagnose the problem correctly, for this, we will identify the main WAITS that we can get and how to solve the problem.
SQL SERVER WAITS TYPES
Ref: https://www.sqlshack.com/sql-server-wait-types
Most Common WAITS types and its solution:
1º CXPACKET:
Notice that many execution queries are being parallelized. This does not have to be BAD, but it does consume additional CPU resources, if the processor utilization on the Instance is GENERALLY above 80%, we should investigate.
Solution
- It examines the queries that consume more CPU to see if they can be Optimized or if they ask for a Missing Index. These queries are clear candidates to be optimized by reviewing their code or creating missing indexes, as this will improve the overall performance of the server.
Here is a link for more information: https://learn.microsoft.com/en-us/troubleshoot/sql/performance/troubleshoot-high-cpu-usage-issues
- Configure correctly the MAXDOP and parallelism: We must check if the values of Maximum Parallelism Degree and Cost Threshold for parallelism are the most suitable, a quick definition of parallelism would be the maximum number of cores that a query will be able to use.
Here is a link for more information: https://learn.microsoft.com/en-us/sql/database-engine/configure-windows/configure-the-max-degree-of-parallelism-server-configuration-option?view=sql-server-ver16#recommendations
2º BACKUPIO:
This occurs when a backup job is waiting for data or is waiting for a buffer in which to store data. This type is not typical, except when a task is waiting for a tape mount. Note that all backup waits are also accumulated for restore operations.
Solution
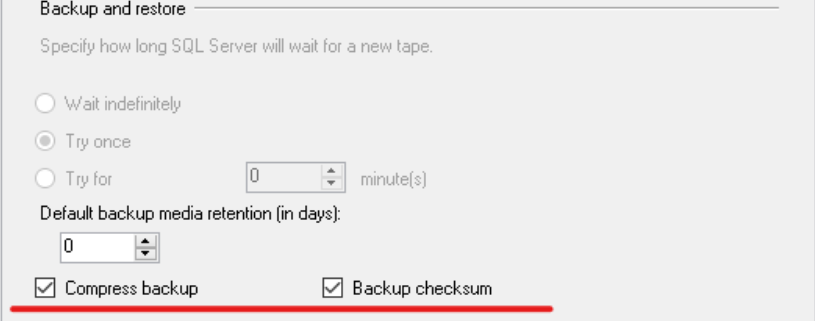
- Activate backup compress if available in the version.

- Remove unused indexes (less data to back up) ALWAYS BE CAREFUL WITH THIS AND MAKE SURE IT IS NOT APPLICABLE.
3º SOS_SCHEDULER_YIELD
SQL Server instances with high CPU usage often show the SOS_SCHEDULER_YIELD wait type. This does not mean that the server is underpowered; it means that more investigation is needed to find which individual task in a query needs more CPU time.
Solution
- Examine the most CPU-consuming queries to see if they can be Optimized or ask us for a Missing Index, for this we will use the previous link provided.
- We can also find in the following DMV (Dynamic Management Views) how many runnable task counts there are in the system. If we observe a two digit number in runnable_tasks_count continuously for a long time ( not from time to time) you will know that there is CPU pressure. The two-digit number is generally considered a bad thing.
DMV executable task count
SELECT scheduler_id, current_tasks_count, runnable_tasks_count, work_queue_count, pending_disk_io_countFROM sys.dm_os_schedulersWHERE scheduler_id < 255GO |
4º ASYNC_NETWORK_IO:
There is nothing that can be done here to tune SQL Server performance. As most commonly it could be a network pipe between the application and the SQL Server (such as a long distance wide area network), an underpowered client machine, or row-by-row processing occurring on the application server.
Solution
- Although we said earlier that as DBAS we can’t do much, we CAN add value to the customer and provide them with information, what we can do to help developers narrow down what is going on, is to run sp_WhoIsActive several times. Look for queries that are waiting on ASYNC_NETWORK_IO, see what the queries are and what machines they are coming from. You may see a pattern of only a couple of queries.
5º WRITELOG:
This indicates that SQL Server is waiting for writes to the LOG disk to complete. If the value is high, it could indicate a bottleneck on the LOG disk.
Solution
- Disable unused indexes. This will decrease the number of writes during data modifications. ALWAYS BE CAREFUL WITH THIS AND MAKE SURE IT IS NOT APPLICATIVE.
- Make sure the FILL FACTOR is set correctly to avoid page splits: The Fill Factor tells us what percentage of the index size will be left free when doing a REBUILD operation. This option is a BEST PRACTICES because leaving enough free space for the internal growth of the index, we will get that all the pages are located in the same sector of the disk so we will avoid fragmentation.

6º PAGEIOLATCH_SH:
This type of wait accumulates while SQL Server waits for a page to be fetched from disk and loaded into memory. The page fetched will be used for one purpose ( read operation). If this value is high, it is likely that the disk or available memory is not up to the workload.
Solution
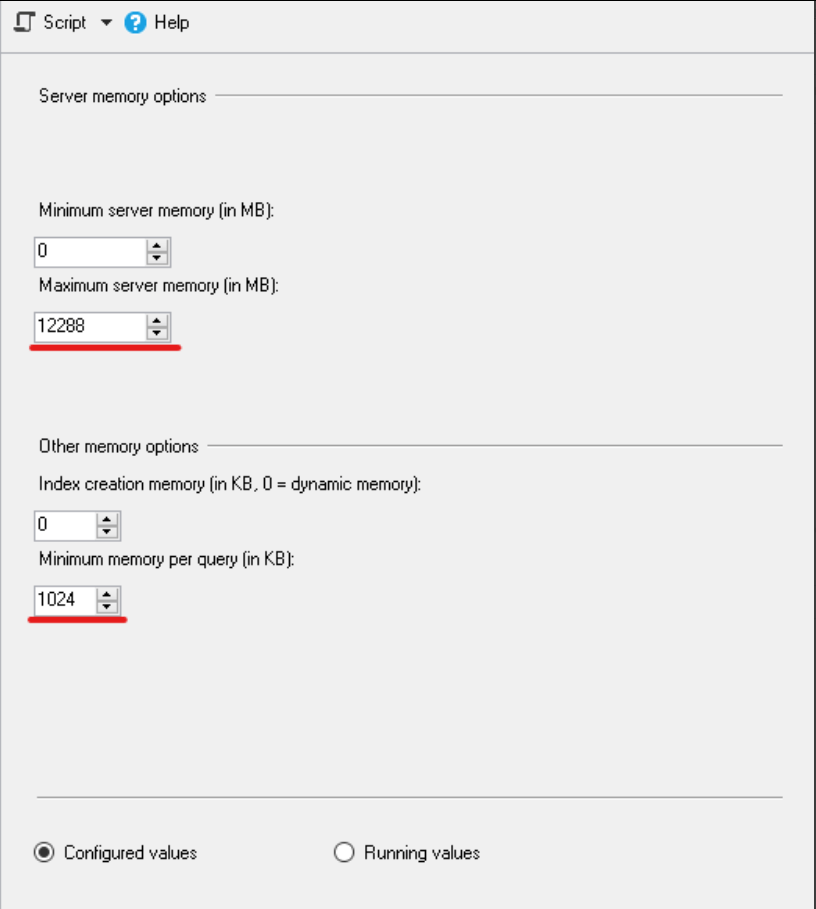
- Increase the maximum memory allocation: Currently in the new versions of SQL Server, it already recommends the Max Server Memory, but if this is not the case, the way to calculate it is RAM minus Cores multiplied by 1024.
Another useful tool to calculate this is: https://sqlmax.chuvash.eu/

- Investigate Disk Latencies: Disk latency provides us with information on reads and writes to SQL Server related disks.
Here is a link for more information: https://theserogroup.com/dba/identifying-sql-server-disk-latency/
- Indexing, look for high disk I/O queries, examine the most CPU consuming queries to see if they can be Optimized or ask us for any Missing Index. Use the link provided above.
- Make sure that the tables of these databases are compressed, since compressed data will travel through the network faster, in addition the size of the database on disk will be reduced and backup or maintenance tasks will be performed considerably faster.
Here is a link for more information: https://sqlstarters.com/2017/03/28/sql-server-data-compression/
- As a last option, add additional memory.
7º LCK_M_S:
This wait occurs when a request is waiting to acquire a shared lock. This usually occurs when read requests are locked by write transactions (implicit or explicit) that have been held open for long periods of time.
Solution
- Investigate the possibility of setting the READ_COMMITEDD_SNAPSHOT configuration at the DB level.
- Examine the most CPU-consuming queries to see if they can be Optimized or ask for a Missing Index. Use the link provided above.
8º OLEDB:
It is common to see this type of wait on instances hosting linked servers. OLEDB is also used in Bulk Insert, the full text engine and within SQL Server Management Studio.
Solution
- Make sure that the Linked Servers are configured with the Best Practices.
Here is a link for more information: https://www.sqlshack.com/how-to-create-and-configure-a-linked-server-in-sql-server-management-studio/
- Optimize queries running on Linked Servers.
- Keep transactions on Linked Servers as short as possible.
- For bulk upload, make sure that the files are placed in fast storage.
9º BACKUPTHREAD:
This wait usually occurs while waiting for some I/O to complete in a thread, such as zero initialization of a data or log file. Note that all backup waits are also accumulated for restore operations.
Solution
- Enable volume maintenance tasks to avoid zero initialization of data files.
- Look at the configuration of the DB growth and make sure that the growth is automatic in a fixed number of megabytes instead of %.
10º RESOURCE_SEMAPHORE:
This occurs when memory requests for queries cannot be granted due to other simultaneous queries. High values of this type of wait may indicate an excessive number of simultaneous queries or excessive memory requests.
Solution
- Make sure that the statistics are up to date. Keep in mind that statistics are one of the most important elements that help the performance of the SQL Server servers. Statistics are the main source of information used by the query optimizer to make decisions on how to resolve a query. With statistics the optimizer can estimate the selectivity of the predicates and thus make decisions about when to use an index or not
- Execute the following script to find out which queries require an excessive amount of memory:
Queries that use more memory
EXEC dbo.sp_BlitzCache @SortOrder = 'memory grant' |
- Make sure that the MAX Server Memory is properly configured.
- Finally, if everything is correct, we must allocate more memory to the SQL Server, since it indicates memory pressure.
11º LCK_M_U:
This wait occurs while an application is waiting to acquire an update lock. An update lock is not just for UPDATE operations. They are used when SQL Server needs to read and then modify a row/page/table. Prior to the modifications, you will place an update lock on the data. Once the system is ready, these locks will be updated to unique locks. This wait usually occurs while the modification requests are locked by other write transactions (implicit or explicit).
Solution
- Keep transaction durations short or view transactions that are sleeping.
- Ensure that transaction isolation levels are appropriate (avoid SERIALIZABLE and REPEATABLE READ if possible).
- Enable if possible the configuration of the databases in READ_COMMITED_SNAPSHOT.
- Investigate queries for lack of indexation.
And here ends today’s post, we want to recommend the following SQL Server posts:
Learning to organize SQL Server Management Studio for different environments
Discover the main functionalities of SQL Server Always On Cluster
If you have performance problems with your SQL Server, we recommend our SQL Server Health Chek service.

Project Manager at Aleson ITC, Passionate about constantly developing my skills and growing professionally, I love technology and analysing big data to make strategic decisions.

