MongoDB, solve your slow queries using Profiler

Welcome to a new post in Aleson ITC’s blog.
Usually we find operations that penalize the performance of the MongoDB server but are not easily detectable. That is why in this post we will see how to work with profiler in MongoDB and its usefulness.
We will also discuss how to create an index and assess its impact on slow queries collected in the profiler.
What is profiler?
The profiler is simply a collection called system.profile that is disabled by default. When enabled, it starts logging CRUD operations such as configuration and instance management commands. It is the ideal place to detect queries to be improved.
To have more control over what is recorded in the profiler collection, there are different types of levels:
- 0 –> Profiler is disabled. That is, no command is registered.
- 1 –> You can apply filters to Profiler. For example, to save only the find commands that take more than 400ms.
- 2 –> Profiler logs all operations.
On the other hand, Profiler uses disk space because it writes the commands to the system.profile collection and to the MongoDB log file. It is recommended to avoid Profiler level 2 and level 1 if you do not have a robust threshold specified.
How to use Profiler in MongoDB?
Let’s apply an example. To detect slow queries we will enable Profiler on the database that is experiencing these problems.
To do so, we execute the following statement:
db.setProfilingLevel(1, {filter:{millis:{$gt:400}}})
This command causes all operations that exceed the 400ms threshold to be saved in the system.profile collection.
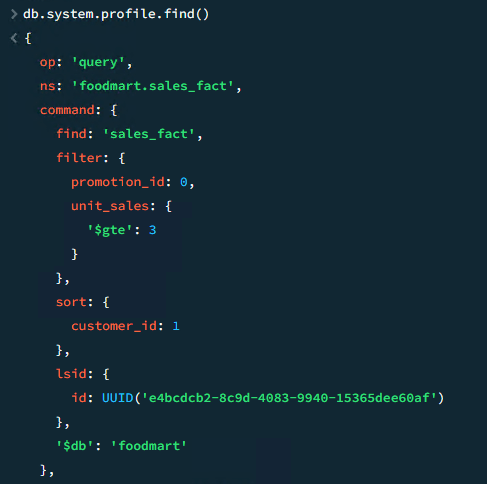
We wait for the slow query to run again and observe that the profiler has saved it. We make a find in to see the information that the profiler indicates us:

It turns out that the slow query is as follows:
db.sales_fact.find({"promotion_id":0, "unit_sales":{$gte : 3}}).sort({"customer_id":1})
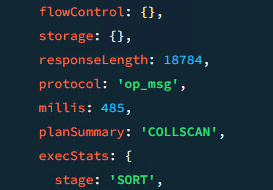
It also tells us that it took 485 milliseconds and that the execution plan was a COLLSCAN. This shows us that you have not used an index and have gone directly to the table to supply the query.

It is obvious that the query needs an index, but, to create one we need to know the ESR rule. Following this rule improves the quality of the indexes.
How to fix slow queries?
The ESR rule specifies the order of the fields when creating an index and must be:
- Equality: That is, the first field must be the one with an exact match condition.
- Sort: The field by which the query will be sorted.
- Range: The field to filter a range of values.
Then, following the ESR rule to create an index that is optimal for the query, let’s create it as follows:
db.sales_fact.createIndex({"promotion_id":1, "customer_id":1, "unit_sales":1})
From MongoDB Compass we can observe the new index:

Next, let’s see if the execution time of the previous query has improved.
First, let’s run an .explain() of the query to see if the execution plan contemplates the new index:
db.sales_fact.find({"promotion_id":0, "unit_sales":{$gte : 3}}).sort({"customer_id":1}).explain()

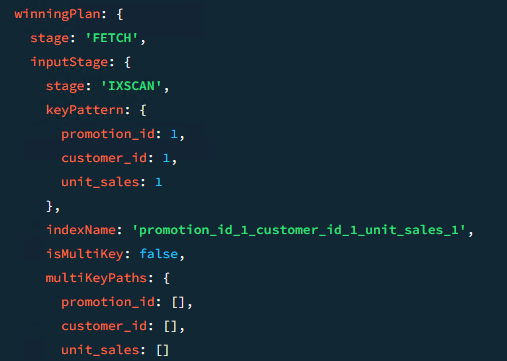
Everything indicates that the query is going to use the index. Let’s check it using level 2 of profiler.
We launch the query again for the profiler to save it:

Indeed, the query uses the created index and currently has an execution time of 0 milliseconds.
After going through this process, we should have no problem improving this type of query.
I hope this blog about MongoDB and Profiler has been useful for you. If you need more information or want to hire our services, do not hesitate to contact us.

Data engineer with experience in SQL Server and MongoDB. Certified as a database administrator and data modeler in MongoDB, I specialize in designing and managing efficient and secure environments for database applications.

