Query Store & Automatic Tuning in SQL Server 2017

In today’s post we are going to talk about Query Store, the repository that we find within our SQL Server databases. First of all, we are going to learn more about the main objective of this tool.
What is Query Store
Query Store was born in SQL Server 2016, but it is not until SQL Server 2017 that it shows its great potential, thus becoming an essential monitoring and troubleshooting tool for database administrators.
Broadly speaking, it simply stores information related to query execution over time. In other words, the Query Store collects all the information that it considers relevant for a possible performance improvement.
The main new advantage over pre-Query Store practices is that previously, performance metrics were added as a single total since the last restart of the SQL instance, and cleared on the next restart. They are now preserved and divided over time so that you can measure changes over time.
The simple activity of storing old execution plans is also important for troubleshooting performance problems. Anyone who has worked with a lot of data in production will have experienced the problem when a query that was working fine suddenly starts to develop performance problems.
A common cause of this is what is known as “regression plan.”
This event occurs when an execution plan is updated and the new one is not as good as the previous one, in this case, it could be analyzed in the Query Store and comparing both plans. We can even force the query to reuse the old plan (which is greater than the current one). If SQL Server detects that the new plan is greater, despite the loss of performance, it would be necessary to dig a little deeper into the code or the indexes of the affected tables in said query since there would be a possible improvement to be implemented.
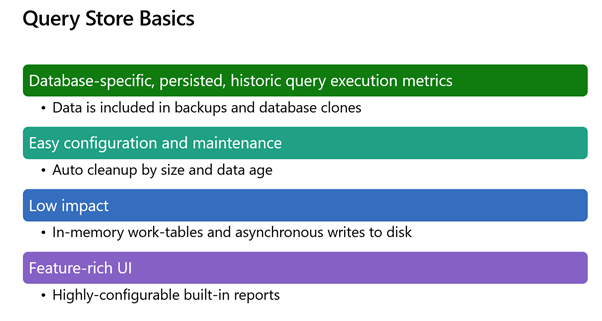
The Query Store is a configuration at the database level and it is important to note that the information obtained by it is stored within the data files, therefore, that means that if you make a backup and restore the database , the information is preserved.
The information is stored asynchronously, so there should be no performance impact on the executed queries. Unlike live query statistics, such as a profiler, the Query Store will not add a performance hit. Of course, there will be general server overhead at the time the data is saved, but that shouldn’t be too significant.

Query Store Activation
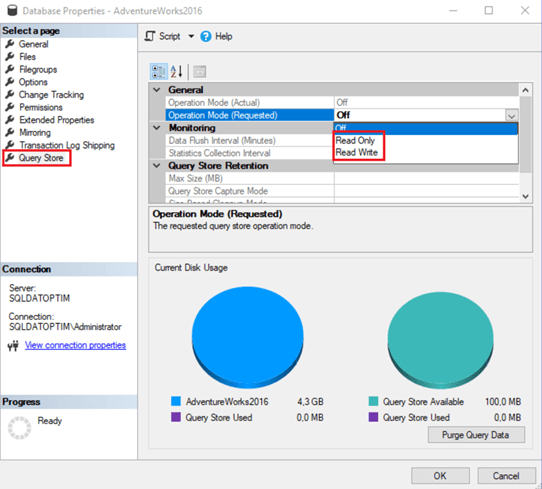
In Azure SQL it is active by default, but in our On-Premise server it will come with the value “Off”, it’s in each of the databases where we will have to go and activate it in the way that we see fit.

The first setting is “Operation Mode”. By default, it is set to “Off”. To enable the Query Store and make it work for a specific database, we will change it to “Read / Write”, in this way, the Query Store will begin to store data about the execution plans and statistics of this database.
The “Data Flush Interval” parameter is the frequency with which the data from the query store is written to disk, as we said, this action will be done asynchronously (15 minutes by default).
The “Statistics Collection Interval” parameter determines how often the query performance metrics are added (1h by default).
The following parameters consist of data retention. The most important thing to note is that if the Query Store fills up and no deletion is done, it will switch to read-only mode. With this, the Query Store will not store any more data, but it will read it in order to continue improving the performance of the queries with the saved data.
The default amount of space set for it is 100 MB; It is not much space, and remember that it is stored in the datafile of each database, so it really is not a problem to enable it.
If we leave the “Size Based Cleanup Mode” parameter set to Automatic, we must ensure that the old data is removed if the query store begins to fill up.
A very important parameter to consider is the “Query Store Capture Mode”: if you leave it in “AUTO”, it will ignore infrequent queries or those with negligible overhead. On the contrary, if we leave it at “ALL”, the Query Store will capture all the queries, including the Ad-hoc or non-parameterized ones. This option is not viable in an environment like the one we have, since it would be hindered by having too many non-parameterized or Ad-hoc queries.
The last parameter is “Stale Query Threshold” is how long it keeps the data in days (30 days by default).
We may consider it useful to increase this value if we want to use the Query Store to be able to monitor performance for a longer period of time, but it may depend on the amount of space that the Query Store wants to consume in the database, remember that the default value is 100 MB but we can increase it whatever is necessary.
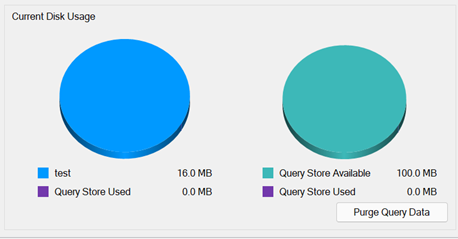
At the bottom of the property page, you can also see some pie charts showing how much of the Query Store database you have allocated and how much of that space it is using.

And so far today’s post, I hope it has helped you when you go to activate the Query Store.
Contact us for more information.

Azure Data Engineer con más de 7 años de experiencia. Conocimiento de múltiples herramientas y enfocado en el mundo del dato. Experto en tuning de queries y mejora de rendimiento de Base de Datos. Profesional apasionado por la tecnología y los deportes al aire libre. En mi tiempo libre, me encontrarás jugando vóley playa o disfrutando con nuevos videojuegos.

