💲 Learning to Convert Currencies with Power BI
When we work with multinational companies, one of the key parts of our model is the Conversion to different Currencies, since, payments are made from different countries with different currencies and the users who view the reports must be able to see them in the currency they choose.
In this post I am going to present you a real example that we had to implement in a customer BI solution.
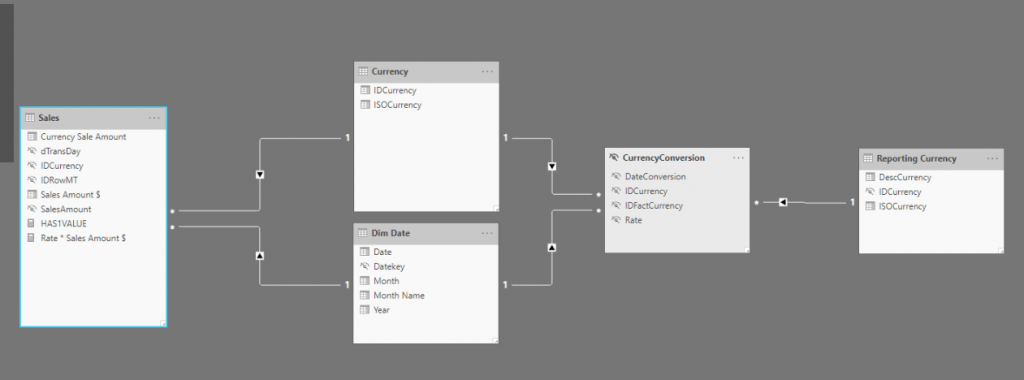
To start I will show you how the finished model would look and then I will describe each table one by one.
Sales
In our model the Sales table would be the fact table. If we explore this table we can see the identifier of the transaction (IDRowMT), the date (dTransDay), the amount (SalesAmount) and the identifier and the name of the Currency of the transaction.

Currency and DimDate
These are two normal dimensions but thanks to them we will be able to relate the currency conversion table (CurrencyConversion) with the fact tables (Sales). If you need more information on how to create a time dimension, you can find it here.
Currency Conversion
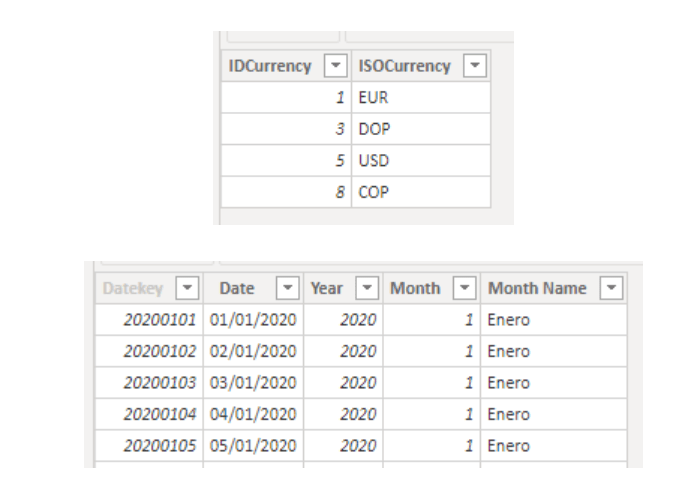
In this table we can find the daily Currency Exchange Rate such as DOP, EUR, USD and COP to USD, since this ratio varies every day.
We always have to choose one currency as the principal and from there make the conversion to the others. In this example we use USD as principal currency.
As you can see in the following image, on the first line it indicates that for 2019/01/01, 1 USD equals 50.54502 DOP.
Reporting Currency
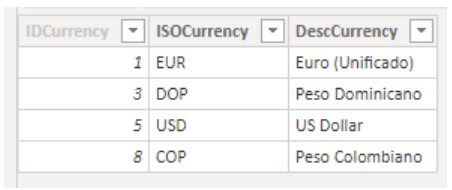
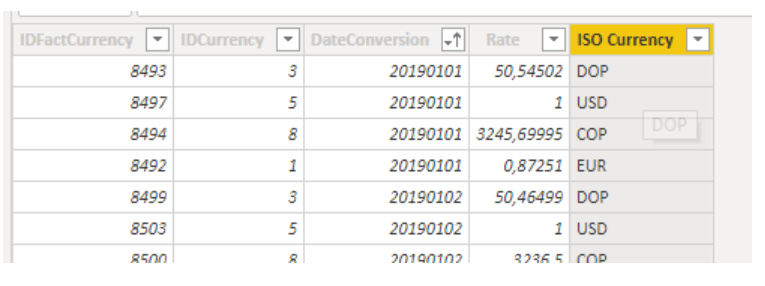
As you can see below, this dimension is identical to Currency, but it is the one that we will only use when we want to visualize the currency change, since, if we used the Currency dimension, it would filter us for the sales that have been made with the type of currency.
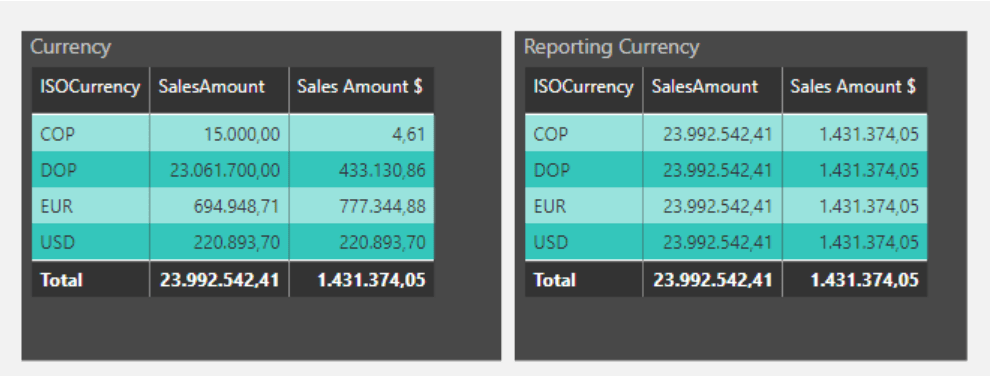
Once we have the model proposed and understanding what each dimension is used for, we can proceed to create the calculated and measured columns to convert to different currencies.
We will start by creating the calculated column Sales Amount $. This column is the one that will be in charge of converting the currency in which the transaction was made to USD. As you can see in the first row, 3.75 EUR would be 4.13 USD.
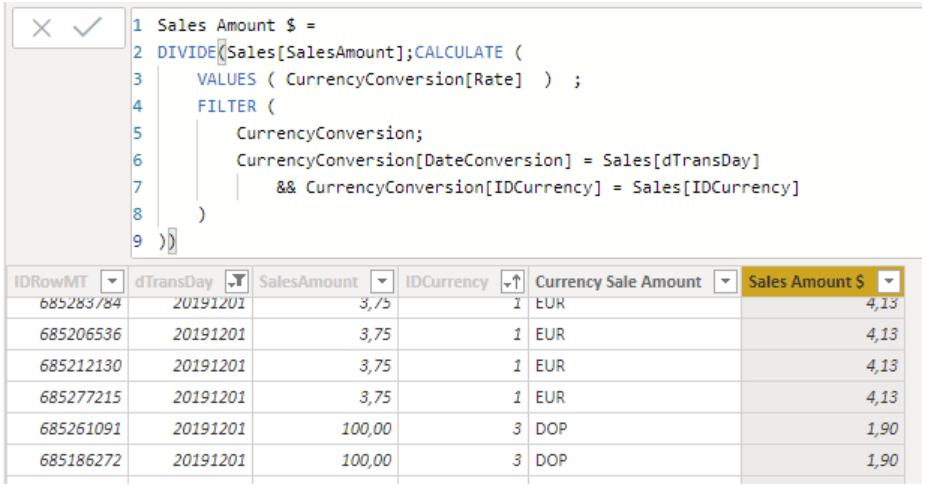
If you observe, the calculation is very simple: it consists of dividing the sale amount by the conversion rate when the conversion rate equals the date of the sale and the currency of the sale.
If we wanted to make the daily currency conversion to another currency, we should create the following calculated column Sales Amount €, in which we multiply the amount Sales Amount $ by the conversion rate to EUR as we can see in the following image.
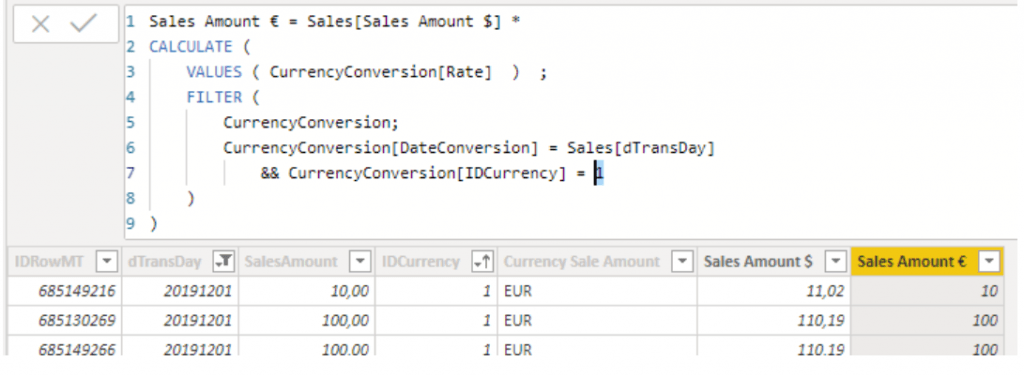
In our case, the customer who asked us for this task, wanted a series of measures in which their amount would appear by the average of the currency exchange ratio within a period of time selected and with all the currencies. For this, we create the following measure:
| 1 | Rate * Sales Amount $ = AVERAGE ( CurrencyConversion[Rate] )* SUM(Sales[Sales Amount $]) |
When delivering the measurement to the customer, they indicated that the total did not make any sense, since the calculation he made was the sum of the amount by the average of all the currencies we had in the Currency Conversion table.
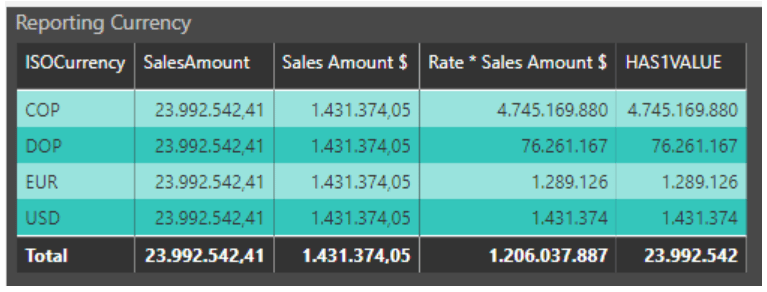
For this reason, we need to create a new measure that, when calculating its total, instead of performing a SUM, AVG, MAX or MIN, would sum the amount without multiplying by the currency exchange rate. In the previous image, you can see the operation of the measurement and in the following, I give you the code of the measurement:
HAS1VALUE =
IF (
    HASONEVALUE ( 'Reporting Currency'[ISOCurrency] );
  AVERAGE ( CurrencyConversion[Rate] )* SUM(Sales[Sales Amount $]); SUM(Sales[SalesAmount]
))
You can download the .pbix with all the calculated columns, measurements, etc. from the following link.
If you want us to help your business or company contact us at info@aleson-itc.com or call us at +34 962 681 242
Business Intelligence Expert Consultant. Specialising in creation of Data Warehouse, Analysis Services, Power BI, SSIS, SSRS and Databricks.

